Sunday's Grammys were a mixture of high and low notes (pun intended), as the joy was often overshadowed by the death of Whitney Houston. As someone who grew up in the 80's singing her songs, I too was quite shocked and saddened. Despite broad speculation of an overdose, I'll wait to post on Whitney until we have a confirmed cause of death.
However, there was a second public health story on Sunday night. It was the three year anniversary of Chris Brown assaulting Rihanna...and he made his return to the stage. While Grammy executive producer Ken Ehrlich has defended the decision to bring Brown back and believes that he deserves a second chance, the warm sentiment was certainly not felt by all. I personally turned the TV off when he began his performance. My facebook and twitter feed blew up with comments from friends and colleagues like, "I'm no math wiz, but I'm pretty sure domestic abuser + 2 years= still a domestic abuser". Many celebrities (both Grammy attendees and beyond) voiced the same sentiments on twitter. For example, Wil Wheaton said simply, "everyone who apparently forgot what Chris Brown did to Rihanna should read the police report on exactly what he did."
Do you think that Chris Brown was worthy of a second chance at the Grammys?
In addition to a discussion of giving second chances, remembering, or forgetting what he did...we must also discuss those who actually encourage what he did. While there were outraged tweets during his performance, there were also those providing support. The tweets that I found most disturbing were those from young women poking fun at the assault and saying that they would be happy to have it happen to them anytime. For example, one woman said, "chris brown could beat me all he wants, he is flawless."
One of the biggest problems in our society is that we have a culture of violence where intimate partner violence is acceptable and abusers are not held responsible for their actions.
What do you think we can do to stop the culture of violence?
In my opinion, Chris Brown is still the same angry and aggressive person that he was 3 years ago. For example, instead of rising above and ignoring any negativity, he continues to lash out. He took to his twitter after the ceremony to address his "haters". He said, "HATE ALL YOU WANT BECUZ I GOT A GRAMMY Now! That's the ultimate F*** OFF!" The tweet has since been deleted and he tried again with a slightly less offensive message. But I don't buy it.
For those of you interested in a more in-depth analysis of the original media coverage of the assault, I'll offer a publication. This article was written by some fantastic colleagues at Boston University School of Public Health:
Rothman, EF, Nageswaran, A, Johnson RM, Adams, KM, Scrivens, J, Baughman, A. (in press). U.S. tabloid magazine coverage of a celebrity dating abuse incident: Rihanna and Chris Brown. Journal of Health Communication. Available online ahead of print.
If you or someone you know needs help, please call the National Domestic Violence Hotline at: 1-800-799-SAFE (7233)
Wednesday, February 15, 2012
Monday, February 13, 2012
Does pork consumption cause cirrhosis? Perhaps, if people become obese from eating pork
The idea that pork consumption may cause cirrhosis has been around for a while. A fairly widely cited 1985 study by Nanji and French () provides one of the strongest indictments of pork: “In countries with low alcohol consumption, no correlation was obtained between alcohol consumption and cirrhosis. However, a significant correlation was obtained between cirrhosis and pork.”
Recently Paul Jaminet wrote a blog post on the possible link between pork consumption and cirrhosis (). Paul should be commended for bringing this topic to the fore, as the implications are far-reaching and very serious. One of the key studies mentioned in Paul’s post is a 2009 article by Bridges (), from which the graphs below were taken.
The graphs above show a correlation between cirrhosis and alcohol consumption of 0.71, and a correlation between cirrhosis and pork consumption of 0.83. That is, the correlation between cirrhosis and pork consumption is the stronger of the two! Combining this with the Nanji and French study, we have evidence that: (a) in countries with low alcohol consumption we can find a significant correlation between cirrhosis and pork consumption; and (b) in countries where both alcohol and pork are consumed, pork consumption has the strongest correlation with cirrhosis.
Do we need anything else to ban pork from our diets? Yes, we do, as there is more to this story.
Clearly alcohol and pork consumption are correlated as well, as we can see from the graphs above. That is, countries where alcohol is consumed more heavily also tend to have higher levels of pork consumption. If alcohol and pork consumption are correlated, then a multivariate analysis of their effects should be conducted, as one of the hypothesized effects (of alcohol or pork) on cirrhosis may even disappear after controlling for the other effect.
I created a dataset, as best as I could, based on the graphs from the Bridges article. (I could not get the data online.) I then entered it into WarpPLS (). I wanted to run a moderating effect analysis, which is a form of nonlinear multivariate analysis. This is important, because the association between alcohol consumption and disease in general is well known to be nonlinear.
In fact, the relationship between alcohol consumption and disease is often used as a classic example of hormesis (), and its characteristic J-curve shape. Since correlation is a measure of linear association, the lower correlation between alcohol consumption and cirrhosis, when compared with pork consumption, may be just a “mirage of linearity”. In multivariate analyses, this mirage of linearity may lead to what are known as type I and II errors, at the same time ().
I should note that the Bridges study did something akin to a moderating effect analysis; through an analysis of the interaction between alcohol and pork consumption. However, in that analysis the values of the variables that were multiplied to create a “dummy” interaction variable were on their original scales, which can be a major source of bias. A more advisable way to conduct an interaction effect analysis is to first make the variables dimensionless, by standardizing them, and then creating a dummy interaction variable as a product of the two variables. That is what WarpPLS does for moderating effects’ estimation.
One more detour, leading to an important implication, and then we will get to the results. In a 1988 article, Jeanneret and colleagues show evidence of a strong and possibly causal association between alcohol consumption and protein-rich diets (). One possible implication of this is that in countries where pork is a dietary staple, like Denmark and Germany, alcohol consumption should be strongly and causally associated with pork consumption. (I guess Anthony Bordain would agree with this eh?)
Below are the results of a multivariate analysis on a model that incorporates the above implication, by including a link between alcohol and pork consumption. The model also explores the role of pork consumption as a moderator of the relationship between alcohol and cirrhosis, as well as the direct effect of pork consumption on cirrhosis. Finally, the total effects of alcohol and pork consumption on cirrhosis are also investigated; they are shown on the left.
The total effects are both statistically significant, with the total effect of alcohol consumption being 94 percent stronger than the total effect of pork consumption on cirrhosis. Looking at the model, alcohol consumption is strongly associated with pork consumption (which is consistent with Jeanneret and colleagues’s study). Alcohol consumption is also strongly associated with cirrhosis, through a direct effect; much more so than pork. Finally, pork consumption seems to strengthen the relationship between alcohol consumption and cirrhosis (the moderating effect).
As we can see the relationship between pork consumption and cirrhosis is still there, in moderating and direct effects, even though it seems to be a lot weaker than that between alcohol consumption and cirrhosis. Why does pork seem to influence cirrhosis at all in this dataset?
Well, there is another factor that is strongly associated with cirrhosis, and that is obesity (). In fact, obesity is associated with just about any major disease, including various types of cancer ().
And in countries where pork is a dietary staple, isn’t it reasonable to assume that pork consumption will play a role in obesity? Often folks who consume a lot of addictive industrial foods (e.g., bread, candy, regular sodas) also eat plenty of foods with saturated fat; and the latter end up showing up in disease statistics, misleadingly supporting the lipid hypothesis. The phenomenon involving pork and cirrhosis may well be similar.
But you may find the above results and argument not convincing enough. Maybe you want to see some evidence that pork is actually good for one’s health. The results above suggest that it may not be bad at all, if you buy into the obesity angle, but not that it can be good.
So I downloaded the most recent data from Nationmaster.com () on the following variables: pork consumption, alcohol consumption, and life expectancy. The list of countries was a bit larger than and different from that in the Bridges study; the following countries were included: Australia, Brazil, Canada, China, Denmark, France, Germany, Hong Kong, Hungary, Japan, Mexico, Poland, Russia, Singapore, Spain, Sweden, United Kingdom, and United States. Below are the results of a simple multivariate analysis with WarpPLS.
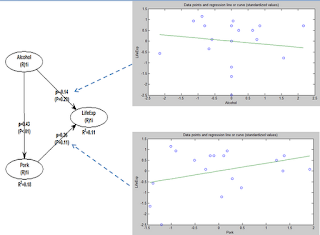
As with the Bridges dataset, there is a strong multivariate association between alcohol and pork consumption (0.43). The multivariate association between alcohol consumption and life expectancy is negative (-0.14). The multivariate association between pork consumption and life expectancy is positive (0.36). Neither association is statistically significant, although the association involving pork consumption gets close to significance with a P=0.11 (a confidence level of 89 percent; calculated through jackknifing, a nonparametric technique). The graphs show the plots for the associations and the best-fitting lines; the blue dashed arrows indicate the multivariate associations to which the graphs refer. So, in this second dataset from Nationmaster.com, the more pork is consumed in a country, the longer is the life expectancy in that country.
In other words, for each 1 standard deviation variation in pork consumption, there is a 0.36 standard deviation variation in life expectancy, after we control for alcohol consumption. The standard deviation for pork consumption is 36.281 lbs/person/year, or 45.087 g/person/day; for life expectancy, it is 4.677 years. Working the numbers a bit more, the results above suggest that each extra gram of pork consumed per person per day is associated with approximately 13 additional days of overall life expectancy in a country! This is calculated as: 4.677/45.087*0.36*365 = 13.630.
Does this prove that eating pork will make you live longer? No single study will “prove” something like that. Pork consumption is also likely a marker for wealth in a country; and wealth is strongly and positively associated with life expectancy at the country level. Moreover, when you aggregate dietary and disease incidence data by country, often the statistical effects are caused by those people in the dietary extremes (e.g., alcohol abuse, not moderate consumption). Finally, if people avoid death from certain diseases, they will die in higher quantities from other diseases, which may bias statistical results toward what may look like a higher incidence of those other diseases.
What the results summarized in this post do suggest is that pork consumption may not be a problem at all, unless you become obese from eating it. How do you get obese from eating pork? Eating it together with industrial foods that are addictive would probably help.
Recently Paul Jaminet wrote a blog post on the possible link between pork consumption and cirrhosis (). Paul should be commended for bringing this topic to the fore, as the implications are far-reaching and very serious. One of the key studies mentioned in Paul’s post is a 2009 article by Bridges (), from which the graphs below were taken.
The graphs above show a correlation between cirrhosis and alcohol consumption of 0.71, and a correlation between cirrhosis and pork consumption of 0.83. That is, the correlation between cirrhosis and pork consumption is the stronger of the two! Combining this with the Nanji and French study, we have evidence that: (a) in countries with low alcohol consumption we can find a significant correlation between cirrhosis and pork consumption; and (b) in countries where both alcohol and pork are consumed, pork consumption has the strongest correlation with cirrhosis.
Do we need anything else to ban pork from our diets? Yes, we do, as there is more to this story.
Clearly alcohol and pork consumption are correlated as well, as we can see from the graphs above. That is, countries where alcohol is consumed more heavily also tend to have higher levels of pork consumption. If alcohol and pork consumption are correlated, then a multivariate analysis of their effects should be conducted, as one of the hypothesized effects (of alcohol or pork) on cirrhosis may even disappear after controlling for the other effect.
I created a dataset, as best as I could, based on the graphs from the Bridges article. (I could not get the data online.) I then entered it into WarpPLS (). I wanted to run a moderating effect analysis, which is a form of nonlinear multivariate analysis. This is important, because the association between alcohol consumption and disease in general is well known to be nonlinear.
In fact, the relationship between alcohol consumption and disease is often used as a classic example of hormesis (), and its characteristic J-curve shape. Since correlation is a measure of linear association, the lower correlation between alcohol consumption and cirrhosis, when compared with pork consumption, may be just a “mirage of linearity”. In multivariate analyses, this mirage of linearity may lead to what are known as type I and II errors, at the same time ().
I should note that the Bridges study did something akin to a moderating effect analysis; through an analysis of the interaction between alcohol and pork consumption. However, in that analysis the values of the variables that were multiplied to create a “dummy” interaction variable were on their original scales, which can be a major source of bias. A more advisable way to conduct an interaction effect analysis is to first make the variables dimensionless, by standardizing them, and then creating a dummy interaction variable as a product of the two variables. That is what WarpPLS does for moderating effects’ estimation.
One more detour, leading to an important implication, and then we will get to the results. In a 1988 article, Jeanneret and colleagues show evidence of a strong and possibly causal association between alcohol consumption and protein-rich diets (). One possible implication of this is that in countries where pork is a dietary staple, like Denmark and Germany, alcohol consumption should be strongly and causally associated with pork consumption. (I guess Anthony Bordain would agree with this eh?)
Below are the results of a multivariate analysis on a model that incorporates the above implication, by including a link between alcohol and pork consumption. The model also explores the role of pork consumption as a moderator of the relationship between alcohol and cirrhosis, as well as the direct effect of pork consumption on cirrhosis. Finally, the total effects of alcohol and pork consumption on cirrhosis are also investigated; they are shown on the left.
The total effects are both statistically significant, with the total effect of alcohol consumption being 94 percent stronger than the total effect of pork consumption on cirrhosis. Looking at the model, alcohol consumption is strongly associated with pork consumption (which is consistent with Jeanneret and colleagues’s study). Alcohol consumption is also strongly associated with cirrhosis, through a direct effect; much more so than pork. Finally, pork consumption seems to strengthen the relationship between alcohol consumption and cirrhosis (the moderating effect).
As we can see the relationship between pork consumption and cirrhosis is still there, in moderating and direct effects, even though it seems to be a lot weaker than that between alcohol consumption and cirrhosis. Why does pork seem to influence cirrhosis at all in this dataset?
Well, there is another factor that is strongly associated with cirrhosis, and that is obesity (). In fact, obesity is associated with just about any major disease, including various types of cancer ().
And in countries where pork is a dietary staple, isn’t it reasonable to assume that pork consumption will play a role in obesity? Often folks who consume a lot of addictive industrial foods (e.g., bread, candy, regular sodas) also eat plenty of foods with saturated fat; and the latter end up showing up in disease statistics, misleadingly supporting the lipid hypothesis. The phenomenon involving pork and cirrhosis may well be similar.
But you may find the above results and argument not convincing enough. Maybe you want to see some evidence that pork is actually good for one’s health. The results above suggest that it may not be bad at all, if you buy into the obesity angle, but not that it can be good.
So I downloaded the most recent data from Nationmaster.com () on the following variables: pork consumption, alcohol consumption, and life expectancy. The list of countries was a bit larger than and different from that in the Bridges study; the following countries were included: Australia, Brazil, Canada, China, Denmark, France, Germany, Hong Kong, Hungary, Japan, Mexico, Poland, Russia, Singapore, Spain, Sweden, United Kingdom, and United States. Below are the results of a simple multivariate analysis with WarpPLS.
As with the Bridges dataset, there is a strong multivariate association between alcohol and pork consumption (0.43). The multivariate association between alcohol consumption and life expectancy is negative (-0.14). The multivariate association between pork consumption and life expectancy is positive (0.36). Neither association is statistically significant, although the association involving pork consumption gets close to significance with a P=0.11 (a confidence level of 89 percent; calculated through jackknifing, a nonparametric technique). The graphs show the plots for the associations and the best-fitting lines; the blue dashed arrows indicate the multivariate associations to which the graphs refer. So, in this second dataset from Nationmaster.com, the more pork is consumed in a country, the longer is the life expectancy in that country.
In other words, for each 1 standard deviation variation in pork consumption, there is a 0.36 standard deviation variation in life expectancy, after we control for alcohol consumption. The standard deviation for pork consumption is 36.281 lbs/person/year, or 45.087 g/person/day; for life expectancy, it is 4.677 years. Working the numbers a bit more, the results above suggest that each extra gram of pork consumed per person per day is associated with approximately 13 additional days of overall life expectancy in a country! This is calculated as: 4.677/45.087*0.36*365 = 13.630.
Does this prove that eating pork will make you live longer? No single study will “prove” something like that. Pork consumption is also likely a marker for wealth in a country; and wealth is strongly and positively associated with life expectancy at the country level. Moreover, when you aggregate dietary and disease incidence data by country, often the statistical effects are caused by those people in the dietary extremes (e.g., alcohol abuse, not moderate consumption). Finally, if people avoid death from certain diseases, they will die in higher quantities from other diseases, which may bias statistical results toward what may look like a higher incidence of those other diseases.
What the results summarized in this post do suggest is that pork consumption may not be a problem at all, unless you become obese from eating it. How do you get obese from eating pork? Eating it together with industrial foods that are addictive would probably help.
Tuesday, February 7, 2012
The NFL Super Bowl Commercial: Has Dedication to Player Safety Really “Evolved”?
In between a fantastic Super Bowl game, gallons of salsa, Madonna’s half-time show, and many disappointing sexist commercials, I patiently waited for the last third quarter commercial break. Almost a week before, the New York Times ran a story about a Super Bowl commercial which would address player safety. The NFL was taking one minute of its own commercial time (valued in the millions) to talk about its commitment to the safety of its players...a commitment which has been questioned over the years.The one minute spot opens in Canton, OH in 1906 and follows one long kick return 100 yards (and 100+ years). The design of the commercial is well done as it follows famous players through the years. As the years progress (as documented on yardage lines), the viewers see and hear a discussion of key safety innovations. For example, we see no helmets turn into leather helmets turn into plastic helmets. We also see the addition of the facemask and the elimination of dangerous hits on players (e.g., horse collar tackles). The voiceover (telling viewers, “Here’s to making the next century safer and more exciting than ever. Forever forward. Forever football”) is provided by a veteran linebacker for the Baltimore Ravens- Ray Lewis.
In any occupational setting, there is concern that creating a culture of safety can be difficult, especially when veterans want things to stay “how they’ve always been”. Lewis has 16 NFL seasons under his belt and a reputation for playing with intensity. In many cases, he would be the hardest kind of player to get on board. Therefore, it is ideal for the Evolution campaign to have recruited someone like Lewis as a champion for its mission!
I also thought that the choice of words “safer and more exciting” were important. One concern about the increase in equipment and restrictions on hits is that it destroys the essence and entertainment of football. That essence being big men hitting each other, playing through pain, and ultimately being declared “stronger” and “winner”. So for Ray Lewis to promise that game excitement will actually increase (along with safety) is quite important for a possibly skeptical audience.
In addition to the commercial, an accompanying website was launched to provide detailed information about the history of the game and various rule changes. The website provides a very cool interactive timeline which outlines each decade. For example, the 1960’s bring “the world’s first Super Bowl”. It also brings fibershell and plastic pads, universally worn facemasks and the banning of grasping a runner’s facemask (1962).
From a public health perspective, I’m impressed with the quality and persuasiveness of both the commercial and website. A successful campaign was really necessary for the NFL, considering that it has been criticized in the past for its lack of commitment to player safety. Most notably, there has been much concern about the NFL’s protocols for dealing with player concussions (and the short and long-term consequences of those injuries). In recent years, we have seen a variety of public health strategies to address concussions.
They have developed and/or expanded safety committees to compile and analyze head injury data. We have seen numerous policy changes regarding both on the field play and the treatment of injuries. For example, in 2009 the NFL adopted a stricter statement on return-to-play for a player who sustains a concussion. The 2009 statement advises that a player who suffers a concussion should not return to play or practice on the same day if he shows any signs or symptoms of a concussion that are outlined in the return-to-play statement. In addition, the NFL has increased its use of financial penalties for helmet to helmet hits which are especially dangerous.
We have also seen educational materials for coaches and players regarding concussions. In fact, Pop Health critiqued the materials released in summer 2010 (“Concussion: A Must Read for NFL Players”).
While there is still criticism of the NFL’s commitment to player safety and there is always room for improvement, I think the “Evolution” campaign is effective. Reflecting over 100 years of football through the commercial and website, it is clear to the audience that they have come a long way. They have used various public health strategies to reduce injuries (i.e., equipment innovation, policy change, education campaigns, and probably the hardest strategy- culture change). In Ray Lewis, they have effectively retained a respected veteran to champion the cause. Finally, they have reassured the fans that the game will remain (and even increase) in excitement despite additional safety measures.
What do you think? Was the commercial just a PR opportunity for the NFL to defend themselves against recent criticism and lawsuits regarding player concussions? Or did you find it to be an effective reflection of successful safety innovation coupled with a sincere commitment to player safety moving forward?
Labels:
football,
health communication,
occupational health
Monday, February 6, 2012
The impressive nutrition value of whole dried small fish
When I visited Japan a few years ago I noticed a variety of dried small fish for sale in grocery stores and supermarkets. They came in what seemed to be vacuum-packed flat plastic bags, often dried. The packing was a bit like that of beef jerky in the USA. Since I could not read the labels, I could not tell if preservatives or things like sugar were added. Beef jerky often has sugar added to it; at least the popular brands.
I have since incorporated dried or almost dried small fish, eaten whole, into my diet. My family eats it, but they don’t seem to like it as much as I do. The easiest small fish to find for sale where I live are smelts. A previous post has a recipe (). I can easily eat 200 g of smelts, about twice as much as on the plate below; not quite dried, but almost so. The veggies are a mix of lettuce and cabbage.
As you can see from the macronutrient composition below (from Nutritiondata.com, for a 100 g portion), 200 g of smelts have about 112 g of protein, and 36 g of fat. No carbohydrates; or a very small amount of them.
Unless you misguidedly think that they will “give you cholesterol”, the macronutrient to calorie ratio of a plate with 200 g of dried (or almost dried) smelts is very good. Let us take a look at the fat content, below (from Nutritiondata.com as well), which is for 100 g of dried smelts.
The “net” omega-3 content of 200 g of dried smelts, after subtracting the omega-6 content, is approximately 4.4 g. The concept of “net” omega-3 content was discussed in a previous post ().
So, the net omega-3 content of 200 g of dried smelts is the equivalent to the net omega-3 content of about 20 fish oil softgels. (Yes, you read it right!) And you would get a lot more omega-6 from the softgels.
Not to mention the fact that isolated omega-3 and omega-6 fats tend to become oxidized much more easily than when they come in “nature’s package”.
Below is the mineral content (also from Nutritiondata.com) of a 100 g portion. Dried smelts are clearly a very good source of selenium. The significant amount of calcium comes mostly from the bones, as with many varieties of small fish that are eaten whole. Combined with the above, we could say that, overall, the nutrient content is high up there next to beef liver as a super food; a natural multivitamin, if you will.
Smelts, like many small non-predatory fish, are not a significant source of toxic metals. Many people avoid seafood because of concerns about toxic metal contamination, particularly mercury. The infamous incident that led to a major scare in that respect – in Minamata, Japan – did involve consumption of small marine animals. But it also involved years of direct and indirect exposure to very high levels of methylmercury from untreated industrial waste.
Other cases have been reported among populations consuming large amounts of whale, shark, dogfish and other relatively large marine animals with tissues compromised via biomagnification. Generally speaking, large predatory fish and predatory aquatic mammals are best avoided as food. If they are consumed, they should be consumed very sporadically.
Many people would say that a plate like the one above, with smelts and veggies, is not very appetizing. But I can really devour it quickly and go for seconds. How come? I use a special spice that enhances the natural flavor or almost any combination of “natural” foods – foods that are not engineered by humans – making them taste delicious.
This special spice is “hunger”. This spice can be your best friend, or your worst enemy.
I have since incorporated dried or almost dried small fish, eaten whole, into my diet. My family eats it, but they don’t seem to like it as much as I do. The easiest small fish to find for sale where I live are smelts. A previous post has a recipe (). I can easily eat 200 g of smelts, about twice as much as on the plate below; not quite dried, but almost so. The veggies are a mix of lettuce and cabbage.
As you can see from the macronutrient composition below (from Nutritiondata.com, for a 100 g portion), 200 g of smelts have about 112 g of protein, and 36 g of fat. No carbohydrates; or a very small amount of them.
Unless you misguidedly think that they will “give you cholesterol”, the macronutrient to calorie ratio of a plate with 200 g of dried (or almost dried) smelts is very good. Let us take a look at the fat content, below (from Nutritiondata.com as well), which is for 100 g of dried smelts.
The “net” omega-3 content of 200 g of dried smelts, after subtracting the omega-6 content, is approximately 4.4 g. The concept of “net” omega-3 content was discussed in a previous post ().
So, the net omega-3 content of 200 g of dried smelts is the equivalent to the net omega-3 content of about 20 fish oil softgels. (Yes, you read it right!) And you would get a lot more omega-6 from the softgels.
Not to mention the fact that isolated omega-3 and omega-6 fats tend to become oxidized much more easily than when they come in “nature’s package”.
Below is the mineral content (also from Nutritiondata.com) of a 100 g portion. Dried smelts are clearly a very good source of selenium. The significant amount of calcium comes mostly from the bones, as with many varieties of small fish that are eaten whole. Combined with the above, we could say that, overall, the nutrient content is high up there next to beef liver as a super food; a natural multivitamin, if you will.
Smelts, like many small non-predatory fish, are not a significant source of toxic metals. Many people avoid seafood because of concerns about toxic metal contamination, particularly mercury. The infamous incident that led to a major scare in that respect – in Minamata, Japan – did involve consumption of small marine animals. But it also involved years of direct and indirect exposure to very high levels of methylmercury from untreated industrial waste.
Other cases have been reported among populations consuming large amounts of whale, shark, dogfish and other relatively large marine animals with tissues compromised via biomagnification. Generally speaking, large predatory fish and predatory aquatic mammals are best avoided as food. If they are consumed, they should be consumed very sporadically.
Many people would say that a plate like the one above, with smelts and veggies, is not very appetizing. But I can really devour it quickly and go for seconds. How come? I use a special spice that enhances the natural flavor or almost any combination of “natural” foods – foods that are not engineered by humans – making them taste delicious.
This special spice is “hunger”. This spice can be your best friend, or your worst enemy.
Sunday, February 5, 2012
Why Everyone is so Angry at Paula Deen- A Guest Post for "The Public's Health"
For my post, I was able to contribute a "Pop Health" story which examined Paula Deen's disclosure of her type 2 diabetes and the media and societal backlash which followed.
What do you think? Do celebrities have the right to talk about their health information whenever and however they feel comfortable? Or do they have a social responsibility to disclose as early as possible- and to discuss it in a way that is most likely to improve the public's health?
Labels:
celebrity,
diabetes,
Health,
media,
Paula Deen,
pop culture
Monday, January 30, 2012
Kleiber's law and its possible implications for obesity
Kleiber's law () is one of those “laws” of nature that is both derived from, and seems to fit quite well with, empirical data. It applies to most animals, including humans. The law is roughly summarized through the equation below, where E = energy expenditure at rest per day, and M = body weight in kilograms.
Because of various assumptions made in the original formulation of the law, the values of E do not translate very well to calories as measured today. What is important is the exponent, and what it means in terms of relative increases in weight. Since the exponent in the equation is 3/4, which is lower than 1, the law essentially states that as body weight increases animals become more efficient from an energy expenditure perspective. For example, the energy expenditure at rest of an elephant, per unit of body weight, is significantly lower than that of a mouse.
The difference in weight does not have to be as large as that between an elephant and a mouse for a clear difference in energy expenditure to be noticed. Moreover, the increase in energy efficiency predicted by the law is independent of what makes up the weight; whether it is more or less lean body mass, for example. And the law is very generic, also applying to different animals of the same species, and even the same animal at different developmental stages.
Extrapolating the law to humans is quite interesting. Let us consider a person weighing 68 kg (about 150 lbs). According to Kleiber's law, and using a constant multiplied to M to make it consistent with current calorie measurement assumptions (see Notes at the end of this post), this person’s energy expenditure at rest per day would be about 1,847 calories.
A person weighing 95 kg (about 210 lbs) would spend 2,374 calories at rest per day according to Kleiber's law. However, if we were to assume a linear increase based on the daily calorie expenditure at a weight of 68 kg, this person weighing 95 kg would spend 2,508 calories per day at rest. The difference of approximately 206 calories per day is a reflection of Kleiber's law.
This difference of 206 calories per day would translate into about 23 g of extra body fat being stored per day. Per month this would be about 688 g, a little more than 1.5 lbs. Not a negligible amount. So, as you become obese, your body becomes even more efficient on a weight-adjusted basis, from an energy expenditure perspective.
One more roadblock to go from obese to lean.
Now, here is the interesting part. It is unreasonable to assume that the extra mass itself has a significantly lower metabolic rate, with this fully accounting for the relative increase in efficiency. It makes more sense to think that the extra mass leads to systemic adaptations, which in turn lead to whole-body economies of scale (). In existing bodies, these adaptations should happen over time, as long-term compensatory adaptations ().
The implications are fascinating. One implication is that, if the compensatory adaptations that lead to a lower metabolic rate are long term, they should also take some time to undo. This is what some call having a “broken metabolism”; which may turn out not to be “broken”, but having some inertia to overcome before it comes back to a former state. Thus, lower metabolic rates should generally be observed in the formerly obese, with reductions compatible with Kleiber's law. Those reductions themselves should be positively correlated with the ratio of time spent in the obese and lean states.
Someone who was obese at 95 kg should have a metabolic rate approximately 5.6 percent lower than a never obese person, soon after reaching a weight of 68 kg (5.6 percent = [2,508 – 2,374] / 2,374). If the compensatory adaptation can be reversed, as I believe it can, we should see slightly lower percentage reductions in studies including formerly obese participants who had been lean for a while. This expectation is consistent with empirical evidence. For example, a study by Astrup and colleagues () concluded that: “Formerly obese subjects had a 3–5% lower mean relative RMR than control subjects”.
Another implication, which is related to the one above, is that someone who becomes obese and goes right back to lean should not see that kind of inertia. That is, that person should go right back to his or her lean resting metabolic rate. Perhaps Drew Manning’s Fit-2-Fat-2-Fit experiment () will shed some light on this possible implication.
A person becoming obese and going right back to lean is not a very common occurrence. Sometimes this is done on purpose, for professional reasons, such as before and after photos for diet products. Believed it or not, there is a market for this!
Notes
- Calorie expenditure estimation varies a lot depending on the equation used. The multiplier used here was 78, based on Cunningham’s equation, and assuming 10 percent body fat. The calorie expenditure for the same 68 kg person using Katch-McArdle’s equation, also assuming 10 percent body fat, would be about 1,692 calories. That would lead to a different multiplier.
- The really important thing to keep in mind, for the purposes of the discussion presented here, is the relative decrease in energy expenditure at rest, per unit of weight, as weight goes up. So we stuck with the 78 multiplier for illustration purposes.
- There is a lot of variation across individuals in energy expenditure at rest due to other factors such as nonexercise activity thermogenesis ().
Because of various assumptions made in the original formulation of the law, the values of E do not translate very well to calories as measured today. What is important is the exponent, and what it means in terms of relative increases in weight. Since the exponent in the equation is 3/4, which is lower than 1, the law essentially states that as body weight increases animals become more efficient from an energy expenditure perspective. For example, the energy expenditure at rest of an elephant, per unit of body weight, is significantly lower than that of a mouse.
The difference in weight does not have to be as large as that between an elephant and a mouse for a clear difference in energy expenditure to be noticed. Moreover, the increase in energy efficiency predicted by the law is independent of what makes up the weight; whether it is more or less lean body mass, for example. And the law is very generic, also applying to different animals of the same species, and even the same animal at different developmental stages.
Extrapolating the law to humans is quite interesting. Let us consider a person weighing 68 kg (about 150 lbs). According to Kleiber's law, and using a constant multiplied to M to make it consistent with current calorie measurement assumptions (see Notes at the end of this post), this person’s energy expenditure at rest per day would be about 1,847 calories.
A person weighing 95 kg (about 210 lbs) would spend 2,374 calories at rest per day according to Kleiber's law. However, if we were to assume a linear increase based on the daily calorie expenditure at a weight of 68 kg, this person weighing 95 kg would spend 2,508 calories per day at rest. The difference of approximately 206 calories per day is a reflection of Kleiber's law.
This difference of 206 calories per day would translate into about 23 g of extra body fat being stored per day. Per month this would be about 688 g, a little more than 1.5 lbs. Not a negligible amount. So, as you become obese, your body becomes even more efficient on a weight-adjusted basis, from an energy expenditure perspective.
One more roadblock to go from obese to lean.
Now, here is the interesting part. It is unreasonable to assume that the extra mass itself has a significantly lower metabolic rate, with this fully accounting for the relative increase in efficiency. It makes more sense to think that the extra mass leads to systemic adaptations, which in turn lead to whole-body economies of scale (). In existing bodies, these adaptations should happen over time, as long-term compensatory adaptations ().
The implications are fascinating. One implication is that, if the compensatory adaptations that lead to a lower metabolic rate are long term, they should also take some time to undo. This is what some call having a “broken metabolism”; which may turn out not to be “broken”, but having some inertia to overcome before it comes back to a former state. Thus, lower metabolic rates should generally be observed in the formerly obese, with reductions compatible with Kleiber's law. Those reductions themselves should be positively correlated with the ratio of time spent in the obese and lean states.
Someone who was obese at 95 kg should have a metabolic rate approximately 5.6 percent lower than a never obese person, soon after reaching a weight of 68 kg (5.6 percent = [2,508 – 2,374] / 2,374). If the compensatory adaptation can be reversed, as I believe it can, we should see slightly lower percentage reductions in studies including formerly obese participants who had been lean for a while. This expectation is consistent with empirical evidence. For example, a study by Astrup and colleagues () concluded that: “Formerly obese subjects had a 3–5% lower mean relative RMR than control subjects”.
Another implication, which is related to the one above, is that someone who becomes obese and goes right back to lean should not see that kind of inertia. That is, that person should go right back to his or her lean resting metabolic rate. Perhaps Drew Manning’s Fit-2-Fat-2-Fit experiment () will shed some light on this possible implication.
A person becoming obese and going right back to lean is not a very common occurrence. Sometimes this is done on purpose, for professional reasons, such as before and after photos for diet products. Believed it or not, there is a market for this!
Notes
- Calorie expenditure estimation varies a lot depending on the equation used. The multiplier used here was 78, based on Cunningham’s equation, and assuming 10 percent body fat. The calorie expenditure for the same 68 kg person using Katch-McArdle’s equation, also assuming 10 percent body fat, would be about 1,692 calories. That would lead to a different multiplier.
- The really important thing to keep in mind, for the purposes of the discussion presented here, is the relative decrease in energy expenditure at rest, per unit of weight, as weight goes up. So we stuck with the 78 multiplier for illustration purposes.
- There is a lot of variation across individuals in energy expenditure at rest due to other factors such as nonexercise activity thermogenesis ().
Labels:
body fat,
fat loss,
Kleiber's law,
metabolic rate,
obesity,
weight loss
Monday, January 23, 2012
All diets succeed at first, and eventually fail
It is not very hard to find studies supporting one diet or another. Gardner and colleagues, for example, conducted a study in which the Atkins diet came out on top when compared with the Zone, Ornish, and LEARN diets (). In Dansinger and colleagues’ study (), on the other hand, following the Atkins diet led to relatively poor results compared with the Ornish, Weight Watchers, and Zone diets.
Often the diets compared have different macronutrient ratios, which end up becoming the focus of the comparison. Many consider Sacks and colleagues’ conclusion, based on yet another diet comparison study (), to be the most consistent with the body of evidence as a whole: “Reduced-calorie diets result in clinically meaningful weight loss regardless of which macronutrients they emphasize”.
I think there is a different conclusion that is even more consistent with the body of evidence out there. This conclusion is highlighted by the findings of almost all diet studies where participants were followed for more than 1 year. But the relevant findings are typically buried in the papers that summarize the studies, and are almost never mentioned in the abstracts. Take for example the study by Toubro and Astrup (); Figure 3 below is used by the authors to highlight the study’s main reported finding: “Ad lib, low fat, high carbohydrate diet was superior to fixed energy intake for maintaining weight after a major weight loss”.
But what does the figure above really tell us? It tells us, quite simply, that both diets succeeded at first, and then eventually failed. One failed slightly less miserably than the other, in this study. The percentage of subjects that maintained a weight loss above 25 kg (about 55 lbs) approached zero after 12 months, in both diets. This leads us to the conclusion below, which is always missing in diet studies even when the evidence is staring back at us. This is arguably the conclusion that is the most consistent with the body of evidence out there.
All diets succeed at first, and eventually fail.
In using the terms “succeed” and “fail” I am referring to the diets’ effects on the majority of the participants. This is in fact better demonstrated by the figure below, from the same study by Toubro and Astrup; it is labeled as Figure 2 there. Most of the participants at a certain weight, lose a lot of weight within a period of 1 year or so, and after 2 years (see the two points at the far right) are at the same original weight again. What is the average time to regain back the weight? From what I’ve seen in the literature, all the weight and some tends to be regained after 2-3 years.
The regained weight is not at all lean body mass. It is primarily, if not entirely, body fat. In fact, many studies suggest that those who diet tend to have a higher percentage of body fat when they regain their original weight; proportionally to how fast they regain the weight lost. Since the extra body fat tends to cause additional problems, which are compounded by the dieting process’ toll on the body, those dieters would have been slightly better off not having dieted in the first place.
Guyenet and Schwartz have recently authored an article that summarizes quite nicely what tends to happen with both obese and lean dieters (). Take a look at Figure 2 of the article below. The obese need to lose body fat to improve health markers, and avoid a number of downstream complications, such as type 2 diabetes and cancer (). Yet, with very few exceptions, the obese (and even the overweight) remain obese (or overweight) after dieting; regardless of the diet.
So what about those exceptions, what do they do to lose significant amounts of body fat and keep it off? Well, I rarely use myself as an example for anything in this blog, but this is something with which I unfortunately/fortunately have personal experience. I was obese, lost about 60 lbs of weight, and kept it off for quite a while already (). Like most of the formerly obese, I can very easily gain body fat back.
But I don’t seem to be gaining back the formerly lost body fat, and the reason is consistent with some of the studies based on data from the National Weight Control Registry, which stores information about adults who lost 30 lbs or more of weight and kept it off for at least 1 year (). I systematically measure my weight, body fat percentage, and a number of other variables; probably even more than the average National Weight Control Registry member. Based on those measurements, I try to understand how my body responds in the short and long term to stimuli such as different exercise, types of food, calorie restriction, sleep patterns etc.
And I act accordingly to keep any body fat gain from happening; by, for example, varying calorie intake, increasing exercise intensity, varying the types of food I eat etc. With a few exceptions (e.g., avoiding industrial seed oils), there is no generic formula. Customization based on individual responses and cyclical patterns seems to be a must.
Looking back, it was relatively easy for me to lose all that fat. This is consistent with the studies summarized in this post; all diets that rely on caloric reduction work marvelously at first for most people. The really difficult part is to keep the body fat off. I believe that this is especially true as the initial years go by, and becomes easier after that. This has something to do with initial inertia, which I will discuss soon in a post on metabolic rates and their relationship with overall body mass.
For people living in the wild, I can see one thing working in their favor. And that is not regular starvation; sapiens is too smart for that. It is laziness. Hunger has to reach a certain threshold for people to want to do some work to get their food; this acts as a natural body composition regulator, something that I intend to discuss in one of my next posts. It seems that people almost never become obese in the wild, without access to industrial foods.
As for living in the wild, in spite of the romantic portrayals of it, the experience is not as appealing after you really try it. The book Yanomamo: The Fierce People () is a solid, if not somewhat shocking, reminder of that. I had the opportunity to meet and talk at length with its author, the great anthropologist Nap Chagnon, at one of the Human Behavior and Evolution Society conferences. The man is a real-life Indiana Jones ().
In the formerly obese, the body seems to resort to “guerrilla warfare”, employing all kinds of physiological and psychological mechanisms, some more subtle than others, to make sure that the lost fat is recovered. Why? I have some ideas, which I have discussed indirectly in posts throughout this blog, but I still need to understand the whole process a bit better. My ideas build on the notion of compensatory adaptation ().
You might have heard some very smart people say that you do not need to measure anything to lose body fat and keep it off. Many of those people have never been obese. Those who have been obese often had not cleared the 2-3 year “danger zone” by the time they made those statements.
There are many obese or overweight public figures (TV show hosts, actors, even health bloggers) who embark on a diet and lose a dramatic amount of body fat. They talk and/or write for a year or so about their success, and then either “disappear” or start complaining about health issues. Those health issues are often part of the “guerrilla warfare” I mentioned above.
A few persistent public figures will gain the fat back, in part or fully, and do the process all over again. It makes for interesting drama, and at least keeps those folks in the limelight.
Often the diets compared have different macronutrient ratios, which end up becoming the focus of the comparison. Many consider Sacks and colleagues’ conclusion, based on yet another diet comparison study (), to be the most consistent with the body of evidence as a whole: “Reduced-calorie diets result in clinically meaningful weight loss regardless of which macronutrients they emphasize”.
I think there is a different conclusion that is even more consistent with the body of evidence out there. This conclusion is highlighted by the findings of almost all diet studies where participants were followed for more than 1 year. But the relevant findings are typically buried in the papers that summarize the studies, and are almost never mentioned in the abstracts. Take for example the study by Toubro and Astrup (); Figure 3 below is used by the authors to highlight the study’s main reported finding: “Ad lib, low fat, high carbohydrate diet was superior to fixed energy intake for maintaining weight after a major weight loss”.
But what does the figure above really tell us? It tells us, quite simply, that both diets succeeded at first, and then eventually failed. One failed slightly less miserably than the other, in this study. The percentage of subjects that maintained a weight loss above 25 kg (about 55 lbs) approached zero after 12 months, in both diets. This leads us to the conclusion below, which is always missing in diet studies even when the evidence is staring back at us. This is arguably the conclusion that is the most consistent with the body of evidence out there.
All diets succeed at first, and eventually fail.
In using the terms “succeed” and “fail” I am referring to the diets’ effects on the majority of the participants. This is in fact better demonstrated by the figure below, from the same study by Toubro and Astrup; it is labeled as Figure 2 there. Most of the participants at a certain weight, lose a lot of weight within a period of 1 year or so, and after 2 years (see the two points at the far right) are at the same original weight again. What is the average time to regain back the weight? From what I’ve seen in the literature, all the weight and some tends to be regained after 2-3 years.
The regained weight is not at all lean body mass. It is primarily, if not entirely, body fat. In fact, many studies suggest that those who diet tend to have a higher percentage of body fat when they regain their original weight; proportionally to how fast they regain the weight lost. Since the extra body fat tends to cause additional problems, which are compounded by the dieting process’ toll on the body, those dieters would have been slightly better off not having dieted in the first place.
Guyenet and Schwartz have recently authored an article that summarizes quite nicely what tends to happen with both obese and lean dieters (). Take a look at Figure 2 of the article below. The obese need to lose body fat to improve health markers, and avoid a number of downstream complications, such as type 2 diabetes and cancer (). Yet, with very few exceptions, the obese (and even the overweight) remain obese (or overweight) after dieting; regardless of the diet.
So what about those exceptions, what do they do to lose significant amounts of body fat and keep it off? Well, I rarely use myself as an example for anything in this blog, but this is something with which I unfortunately/fortunately have personal experience. I was obese, lost about 60 lbs of weight, and kept it off for quite a while already (). Like most of the formerly obese, I can very easily gain body fat back.
But I don’t seem to be gaining back the formerly lost body fat, and the reason is consistent with some of the studies based on data from the National Weight Control Registry, which stores information about adults who lost 30 lbs or more of weight and kept it off for at least 1 year (). I systematically measure my weight, body fat percentage, and a number of other variables; probably even more than the average National Weight Control Registry member. Based on those measurements, I try to understand how my body responds in the short and long term to stimuli such as different exercise, types of food, calorie restriction, sleep patterns etc.
And I act accordingly to keep any body fat gain from happening; by, for example, varying calorie intake, increasing exercise intensity, varying the types of food I eat etc. With a few exceptions (e.g., avoiding industrial seed oils), there is no generic formula. Customization based on individual responses and cyclical patterns seems to be a must.
Looking back, it was relatively easy for me to lose all that fat. This is consistent with the studies summarized in this post; all diets that rely on caloric reduction work marvelously at first for most people. The really difficult part is to keep the body fat off. I believe that this is especially true as the initial years go by, and becomes easier after that. This has something to do with initial inertia, which I will discuss soon in a post on metabolic rates and their relationship with overall body mass.
For people living in the wild, I can see one thing working in their favor. And that is not regular starvation; sapiens is too smart for that. It is laziness. Hunger has to reach a certain threshold for people to want to do some work to get their food; this acts as a natural body composition regulator, something that I intend to discuss in one of my next posts. It seems that people almost never become obese in the wild, without access to industrial foods.
As for living in the wild, in spite of the romantic portrayals of it, the experience is not as appealing after you really try it. The book Yanomamo: The Fierce People () is a solid, if not somewhat shocking, reminder of that. I had the opportunity to meet and talk at length with its author, the great anthropologist Nap Chagnon, at one of the Human Behavior and Evolution Society conferences. The man is a real-life Indiana Jones ().
In the formerly obese, the body seems to resort to “guerrilla warfare”, employing all kinds of physiological and psychological mechanisms, some more subtle than others, to make sure that the lost fat is recovered. Why? I have some ideas, which I have discussed indirectly in posts throughout this blog, but I still need to understand the whole process a bit better. My ideas build on the notion of compensatory adaptation ().
You might have heard some very smart people say that you do not need to measure anything to lose body fat and keep it off. Many of those people have never been obese. Those who have been obese often had not cleared the 2-3 year “danger zone” by the time they made those statements.
There are many obese or overweight public figures (TV show hosts, actors, even health bloggers) who embark on a diet and lose a dramatic amount of body fat. They talk and/or write for a year or so about their success, and then either “disappear” or start complaining about health issues. Those health issues are often part of the “guerrilla warfare” I mentioned above.
A few persistent public figures will gain the fat back, in part or fully, and do the process all over again. It makes for interesting drama, and at least keeps those folks in the limelight.
Labels:
Atkins,
body fat,
cancer,
LEARN,
my experience,
National Weight Control Registry,
Ornish,
Weight Watchers,
Zone
Subscribe to:
Posts (Atom)


