Sunday, April 24, 2011

Alcohol consumption, gender, and type 2 diabetes: Strange … but true

Let me start this post with a warning about spirits (hard liquor). Taken on an empty stomach, they cause an acute suppression of liver glycogenesis. In other words, your liver becomes acutely insulin resistant for a while. How long? It depends on how much you drink; possibly as long as a few hours. So it is not a very good idea to consume them immediately before eating carbohydrate-rich foods, natural or not, or as part of sweet drinks. You may end up with near diabetic blood sugar levels, even if your liver is insulin sensitive under normal circumstances.

The other day I was thinking about this, and the title of this article caught my attention: Alcohol Consumption and the Risk of Type 2 Diabetes Mellitus. This article is available here in full text. In it, Kao and colleagues show us a very interesting table (Table 4), relating alcohol consumption in men and women with incidence of type 2 diabetes. I charted the data from Model 3 in that table, and here is what I got:


I used the data from Model 3 because it adjusted for a lot of things: age, race, education, family history of diabetes, body mass index, waist/hip ratio, physical activity, total energy intake, smoking history, history of hypertension, fasting serum insulin, and fasting serum glucose. Whoa! As you can see, Model 3 even adjusted for preexisting insulin resistance and impaired glucose metabolism.

So, according to the charts, the more women drink, the lower is the risk of developing type 2 diabetes, even if they drink more than 21 drinks per week. For men, the sweet spot is 7-14 drinks per week; after 21 drinks per week the risk goes up significantly.

A drink is defined as: a 4-ounce glass of wine, a 12-ounce bottle or can of beer, or a 1.5-ounce shot of hard liquor. The amounts of ethanol vary, with more in hard liquor: 4 ounces of wine = 10.8 g of ethanol, 12 ounces of beer = 13.2 g of ethanol, and 1.5 ounces of spirits = 15.1 g of ethanol.

Initially I thought that these results were due to measurement error, particularly because the study relies on questionnaires. But I did some digging and checking, and now think they are not. In fact, there are plausible explanations for them. Here is what I think, and it has to do with a fundamental difference between men and women – sex hormones.

In men, alcohol consumption, particularly in large quantities, suppresses testosterone production. And testosterone levels are inversely associated with diabetes in men. Heavy alcohol consumption also increases estrogen production in men, which is not good news either.

In women, alcohol consumption, particularly in large quantities, increases estrogen production. And estrogen levels are (you guessed it) inversely associated with diabetes in women. Unnatural suppression of testosterone levels in women is not good either, as this hormone also plays important roles in women; e.g., it influences mood and bone density.

What if we were to disregard the possible negative health effects of suppressing testosterone production in women; should women start downing 21 drinks or more per week? The answer is “no”, because alcohol consumption, particularly in large quantities, increases the risk of breast cancer in women. So, for women, alcohol consumption in moderation may also provide overall health benefits, as it does for men; but for different reasons.

Monday, April 11, 2011

Beef meatballs, with no spaghetti

There are pizza restaurants, whose specialty is pizza, even though they usually have a few side dishes. Not healthy enough?

Well, don’t despair, there are meatball restaurants too. I know of at least one, The Meatball Shop, on 84 Stanton Street, in New York City.

Finally a restaurant that elevates the "lowly" meatball to its well deserved place!

Meatballs are delicious, easy to prepare, and you can use quite a variety of meats to do them. Below is a simple recipe. We used ground grass-fed beef, not because of omega-6 concerns (see this post), but because of the different taste.

- Prepare some dry seasoning powder by mixing sea salt, parsley, garlic power, chili powder, and a small amount of cayenne pepper.
- Thoroughly mix 1 pound of ground beef, one or two eggs, and the seasoning powder.
- Make about 10 meatballs, and place them in a frying pan with a small amount of water (see picture below).
- Cover the pan and cook on low fire for about 1 hour.


There is no need for any oil in the pan. On a low fire the small amount of water at the bottom will heat up, circulate, and essentially steam the meatballs. The water will also prevent the meatballs from sticking to the pan. Some moisture will also be released by the meat.

Part of the fat from the meat will be released and accumulate at the bottom of the pan. If you add tomato sauce and mix, the fat will become part of the resulting red sauce. This sauce will add moisture back to the dish, as the meatballs sometimes get a bit dry from the cooking.

Five meatballs of the type that we used (about 15 percent fat) will have about 57 g of protein and 32 g of fat; the latter mostly saturated and monounsaturated (both healthy). They will also be a good source of vitamins B12 and B6, niacin, zinc, selenium, and phosphorus.

Add a fruit or a sweet potato as a side dish to 3-5 meatballs and you have a delicious and nutritious meal that may eve impress some people!

Monday, April 4, 2011

The China Study II: Carbohydrates, fat, calories, insulin, and obesity

The “great blogosphere debate” rages on regarding the effects of carbohydrates and insulin on health. A lot of action has been happening recently on Peter’s blog, with knowledgeable folks chiming in, such as Peter himself, Dr. Harris, Dr. B.G. (my sista from anotha mista), John, Nigel, CarbSane, Gunther G., Ed, and many others.

I like to see open debate among people who hold different views consistently, are willing to back them up with at least some evidence, and keep on challenging each other’s views. It is very unlikely that any one person holds the whole truth regarding health matters. Unfortunately this type of debate also confuses a lot of people, particularly those blog lurkers who want to get all of their health information from one single source.

Part of that “great blogosphere debate” debate hinges on the effect of low or high carbohydrate dieting on total calorie consumption. Well, let us see what the China Study II data can tell us about that, and about a few other things.

WarpPLS was used to do the analyses below. For other China Study analyses, many using WarpPLS as well as HealthCorrelator for Excel, click here. For the dataset used here, visit the HealthCorrelator for Excel site and check under the sample datasets area.

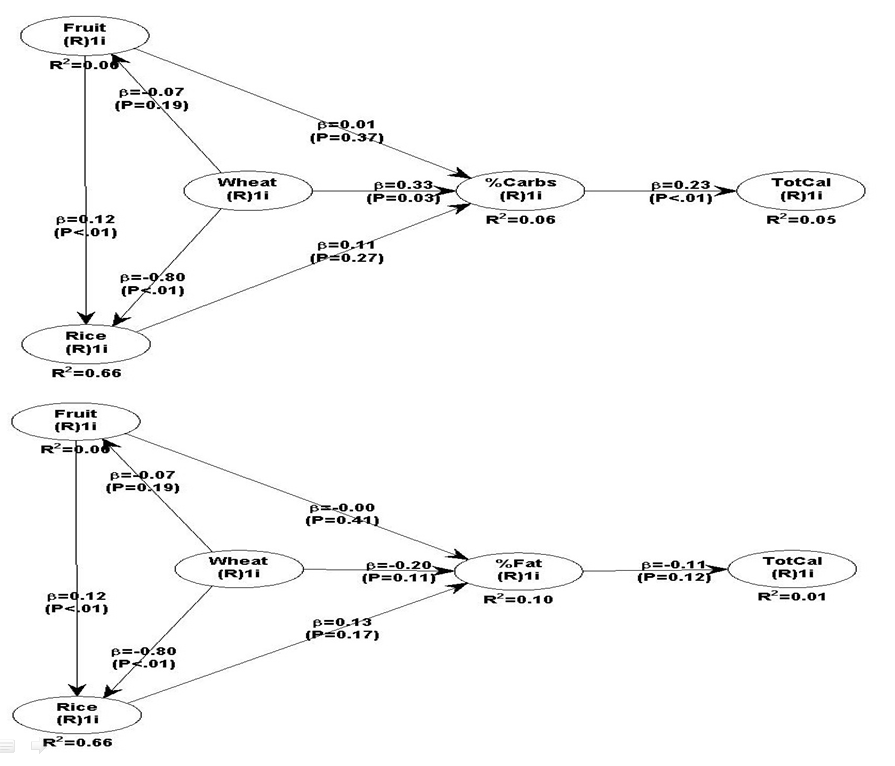
The two graphs below show the relationships between various foods, carbohydrates as a percentage of total calories, and total calorie consumption. A basic linear analysis was employed here. As carbohydrates as a percentage of total calories go up, the diet generally becomes a high carbohydrate diet. As it goes down, we see a move to the low carbohydrate end of the scale.


The left parts of the two graphs above are very similar. They tell us that wheat flour consumption is very strongly and negatively associated with rice consumption; i.e., wheat flour displaces rice. They tell us that fruit consumption is positively associated with rice consumption. They also tell us that high wheat flour consumption is strongly and positively associated with being on a high carbohydrate diet.

Neither rice nor fruit consumption has a statistically significant influence on whether the diet is high or low in carbohydrates, with rice having some effect and fruit practically none. But wheat flour consumption does. Increases in wheat flour consumption lead to a clear move toward the high carbohydrate diet end of the scale.

People may find the above results odd, but they should realize that white glutinous rice is only 20 percent carbohydrate, whereas wheat flour products are usually 50 percent carbohydrate or more. Someone consuming 400 g of white rice per day, and no other carbohydrates, will be consuming only 80 g of carbohydrates per day. Someone consuming 400 g of wheat flour products will be consuming 200 g of carbohydrates per day or more.

Fruits generally have much less carbohydrate than white rice, even very sweet fruits. For example, an apple is about 12 percent carbohydrate.

There is a measure that reflects the above differences somewhat. That measure is the glycemic load of a food; not to be confused with the glycemic index.

The right parts of the graphs above tell us something else. They tell us that the percentage of carbohydrates in one’s diet is strongly associated with total calorie consumption, and that this is not the case with percentage of fat in one’s diet.

Given the above, one may be interested in looking at the contribution of individual foods to total calorie consumption. The graph below focuses on that. The results take nonlinearity into consideration; they were generated using the Warp3 algorithm option of WarpPLS.


As you can see, wheat flour consumption is more strongly associated with total calories than rice; both associations being positive. Animal food consumption is negatively associated, somewhat weakly but statistically significantly, with total calories. Let me repeat for emphasis: negatively associated. This means that, as animal food consumption goes up, total calories consumed go down.

These results may seem paradoxical, but keep in mind that animal foods displace wheat flour in this dataset. Note that I am not saying that wheat flour consumption is a confounder; it is controlled for in the model above.

What does this all mean?

Increases in both wheat flour and rice consumption lead to increases in total caloric intake in this dataset. Wheat has a stronger effect. One plausible mechanism for this is abnormally high blood glucose elevations promoting abnormally high insulin responses. Refined carbohydrate-rich foods are particularly good at raising blood glucose fast and keeping it elevated, because they usually contain a lot of easily digestible carbohydrates. The amounts here are significantly higher than anything our body is “designed” to handle.

In normoglycemic folks, that could lead to a “lite” version of reactive hypoglycemia, leading to hunger again after a few hours following food consumption. Insulin drives calories, as fat, into adipocytes. It also keeps those calories there. If insulin is abnormally elevated for longer than it should be, one becomes hungry while storing fat; the fat that should have been released to meet the energy needs of the body. Over time, more calories are consumed; and they add up.

The above interpretation is consistent with the result that the percentage of fat in one’s diet has a statistically non-significant effect on total calorie consumption. That association, although non-significant, is negative. Again, this looks paradoxical, but in this sample animal fat displaces wheat flour.

Moreover, fat leads to no insulin response. If it comes from animals foods, fat is satiating not only because so much in our body is made of fat and/or requires fat to run properly; but also because animal fat contains micronutrients, and helps with the absorption of those micronutrients.

Fats from oils, even the healthy ones like coconut oil, just do not have the latter properties to the same extent as unprocessed fats from animal foods. Think slow-cooking meat with some water, making it release its fat, and then consuming all that fat as a sauce together with the meat.

In the absence of industrialized foods, typically we feel hungry for those foods that contain nutrients that our body needs at a particular point in time. This is a subconscious mechanism, which I believe relies in part on past experience; the reason why we have “acquired tastes”.

Incidentally, fructose leads to no insulin response either. Fructose is naturally found mostly in fruits, in relatively small amounts when compared with industrial foods rich in refined sugars.

And no, the pancreas does not get “tired” from secreting insulin.

The more refined a carbohydrate-rich food is, the more carbohydrates it tends to pack per unit of weight. Carbohydrates also contribute calories; about 4 calories per g. Thus more carbohydrates should translate into more calories.

If someone consumes 50 g of carbohydrates per day in excess of caloric needs, that will translate into about 22.2 g of body fat being stored. Over a month, that will be approximately 666.7 g. Over a year, that will be 8 kg, or 17.6 lbs. Over 5 years, that will be 40 kg, or 88 lbs. This is only from carbohydrates; it does not consider other macronutrients.

There is no need to resort to the “tired pancreas” theory of late-onset insulin resistance to explain obesity in this context. Insulin resistance is, more often than not, a direct result of obesity. Type 2 diabetes is by far the most common type of diabetes; and most type 2 diabetics become obese or overweight before they become diabetic. There is clearly a genetic effect here as well, which seems to moderate the relationship between body fat gain and liver as well as pancreas dysfunction.

It is not that hard to become obese consuming refined carbohydrate-rich foods. It seems to be much harder to become obese consuming animal foods, or fruits.

Monday, March 28, 2011

Chew your calories and drink water: Industrial beverages and tooth erosion

Dental erosion is a different problem from dental caries. Dental erosion is defined as the removal of minerals from the tooth structure via chemicals. Dental caries are the result of increased site-specific acidity due to bacterial fermentation of sugars.

Still, both have the same general result, destruction of teeth structure.

Losing teeth probably significantly accelerated death among our Paleolithic ancestors, as it does with modern hunter-gatherers. It is painful and difficult to eat nutritious foods when one has teeth problems, and chronic lack of proper nutrition is the beginning of the end.

The table below, from Ehlen et al. (2008), shows the amount of erosion that occurred when teeth were exposed to beverages for 25 h in vitro. Erosion depth is measured in microns. The third row shows the chance probabilities (i.e., P values) associated with the differences in erosion of enamel and root. These are not particularly enlightening; enamel and root are both significantly eroded.


These results reflect a broader trend. Nearly all industrial beverages cause erosion, even the “healthy” fruit juices. This is due in part, but not entirely, to the acidity of the beverages. Other chemicals contribute to erosion as well. For example, Coke has a lower pH than Gatorade, but the latter causes more erosion of both enamel and root. Still, both pHs are lower than 4.0. The pH of pure water is a neutral 7.0.

Coke is how my name is pronounced, by the way.

This was a study in vitro. Is there evidence of tooth erosion by industrial beverages in people who drink them? Yes, there is quite a lot of evidence, and this evidence dates back many years. You would not guess it by looking at beverage commercials. See, for example, this article.

What about eating the fruits that are used to make the erosion-causing fruit juices? Doesn’t that cause erosion as well? Apparently not, because chewing leads to the release of a powerful protective substance, which is also sometimes exchanged by pairs of people who find each other attractive.

Reference

Leslie A. Ehlen, Teresa A. Marshall, Fang Qian, James S. Wefel, and John J. Warren (2008). Acidic beverages increase the risk of in vitro tooth erosion. Nutrition Research, 28(5), 299–303.

Saturday, March 26, 2011

"This is Public Health" is now an iPhone Application!


In March 2011, the Association of Schools of Public Health (ASPH) launched a new This Is Public Health (TIPH) iPhone application. It is available via the Apple itunes store. “This innovative application will allow users to digitally place an image of the TIPH sticker in photographs on their mobile device, so they no longer need to have physical stickers with them everywhere they go in order to participate in the campaign.”

The "This is Public Health" campaign was first piloted during the 2008 National Public Health Week.

The TIPH campaign was developed to achieve the following objectives:

  • Increase awareness about public health and the important role public health plays in our daily lives.
  • Position Schools of Public Health as innovative/effective leaders in public health outreach and education.
  • Engage new audiences, including policymakers and funders, in a dialogue about the importance of supporting public health.
  • Attract and inspire the next generation of public health professionals through non-traditional engagement tools.
The campaign uses stickers with the slogan "This is Public Health" placed in locations around the world to help reach its goals.

The campaign's website clearly shows the reach of the campaign- over 1,000 public health practice organizations, individuals, and other academic institutions in over 45 countries have joined the campaign. But of course (as always), I'm interested in seeing an evaluation of the campaign. It was unclear to me from the website how they define their target audience. I was not sure if they wanted to "increase awareness" of public health among "participants" of the campaign (i.e., those giving out the stickers) or among the general public (i.e., those seeing the stickers in various locations). I was able to track down an evaluation report from September 2009 (which covered the first year of the project). For purposes of this report, data was collected from program participants (defined as those that requested stickers or the campaign video). Both qualitative and quantitative data was collected via phone interviews, feedback from public health groups and individuals, a review of program data and statistics, and an online survey. Here are some key findings:
  • The majority of participants [32.7%] learned about the campaign through the ASPH website.
  • Educating the general public about public health, increasing awareness about careers in public health and increasing the understanding of the work of a particular institution were the top three goals of those who executed the campaign locally.
  • When asked to rate on a scale of 1-10 how effective the “This Is Public Health” materials were in achieving their campaign goals, nearly a quarter [23.8%] gave the materials a 10, citing them as “very helpful” and over three-quarters of the respondents rated the effectiveness a 7 or higher.
  • Simplicity and ease of use were what most campaign participants liked best about the “This Is Public Health” campaign.
  • Nearly all respondents [92.1%] said that they were likely to recommend the campaign to colleagues in the public health community with almost 70% saying they were “very likely” to do so.
Interestingly, some areas of mixed review were around the program's website, flickr group (pictures), and interactive google maps. There was some concern that keeping all the program materials online because it excluded those without Internet access. In addition, the adoption of flickr and maps depended on the "tech savviness" of the participants. So seeing that their newest addition is an iPhone application, it will be interesting to see which groups of participants are the earliest adopters of the technology. I look forward to seeing the next evaluation report!

Tuesday, March 22, 2011

A Pop Health Book Review of "The Immortal Life of Henrietta Lacks"

This book is not brand new; it has been out for about a year. However, it continues to pick up momentum and be read by book clubs across the country. Therefore, after it was recommended to me by my mother-in-law, I thought it would be perfect for a Pop Health Book Review.

As someone who works in public health, I collaborate with our University's Institutional Review Board (IRB) on a daily basis to ensure the safety of our research (for the good of our research team, funder, and participants). And even though I know and understand the importance of the collaboration, it can still feel like a burden to address and document each question that is asked by our IRB (I know many of you would agree!) I see the students I work with roll their eyes and sigh when they have to take the IRB and HIPAA trainings. HIPAA stands for Health Insurance Portability and Accountability Act of 1996 Privacy and Security Rules. The students say, "Yeah...we already know this stuff".

However, this book takes what you "already know" and puts a face on it. It reminds you that it wasn't long ago that people (especially vulnerable people) were experimented on and/or used for research without their consent. Often with sad and deadly outcomes.

Rebecca Skloot, an award-winning science writer, takes the reader on her personal journey (lasting over a decade) to learn about the woman behind HeLa cells. The woman's name was Henrietta Lacks. The original cells were taken from her cervix shortly after she was diagnosed with cancer and before her death. HeLa cells have been vital for many scientific advances, including the development of the polio vaccine.

Henrietta's story, pieced together through more than a thousand hours of interviews conducted by Rebecca, touches on the most essential and controversial aspects of public health and research:

1. Treatment/Research on Vulnerable Populations
:
  • Henrietta Lacks was a poor Southern tobacco farmer, seeking medical care from Johns Hopkins "colored" ward in the early 1950s. A sample of her tumor was taken and given to researchers without her consent. She was treated with radiation without a discussion about the side effects. Henrietta had no idea the radiation would cause her to be infertile. The hospital convinced her husband David to agree to an autopsy (after he already refused) by saying that the exam "could help his children one day". The autopsy results were later given to a writer who published all the details in his book.
  • It is no wonder that the IRB now requires specific training and attention to address research that focuses on vulnerable populations. These include pregnant women, fetuses, neonates, prisoners, children, and other special classes of individuals such as minorities and those that are mentally ill.
  • It is no wonder that it can be incredibly difficult to recruit members of these vulnerable groups to participate in research, even today! Henrietta's family spoke of their fears of being snatched off the streets around Johns Hopkins by doctors wanting to experiment on them. Rebecca found research that tales of "night doctors" had filled black oral history since the 1800s. These doctors would kidnap black people for research.
2. Ethical Issues
  • This book examines the ethical issues of sharing human tissue. Consent to share human tissue (e.g., those you have "discarded"after a blood test or biopsy), is not the same as consenting to participate in research. Often consent is not required.
  • But do researchers and doctors have an ethical responsibility to disclose to the patient if (1) their cells/tissues are unique and valuable in some way, (2) the researcher or doctor has a financial interest in their tissue, (3) the patient's tissue will be used in any way that is contrary to their beliefs?
3. Informed Consent
  • Times have certainly changed since 1951 when Henrietta Lacks was subjected to tests and procedures without giving informed consent. Unfortunately, it took about 50 years to get there. Her husband and children were still left in the dark regarding the purpose of blood tests in the years after her death. Scientists wanted to map their genes. The family thought they were being tested for cancer. They waited years for results that never came.
  • Most of Henrietta's family only completed school until their early-mid teenage years. Even when the doctors explained parts of procedures, it was not at a level or in a way that was familiar to them.
  • This book emphasizes the importance of being "informed" in the consent process. If the participants don't understand, their verbal or written consent means nothing.
All of these important issues are discussed with beautiful storytelling by Henrietta's family and Rebecca's careful research. It is a must read, especially for my fellow science and public health friends out there.

You'll find yourself cheering for Henrietta's daughter Deborah and her siblings, who have all endured more than their share of suffering. And probably most important, you'll find yourself making a pact to never sigh when it is time to complete the annual IRB training.

Monday, March 21, 2011

Health markers varying inexplicably? Do some detective work with HCE

John was overweight, out of shape, and experiencing fatigue. What did he do? He removed foods rich in refined carbohydrates and sugars from his diet. He also ditched industrial seed oils and started exercising. He used HealthCorrelator for Excel (HCE) to keep track of several health-related numbers over time (see figure below).


Over the period of time covered in the dataset, health markers steadily improved. For example, John’s HDL cholesterol went from a little under 40 mg/dl to just under 70; see chart below, one of many generated by HCE.


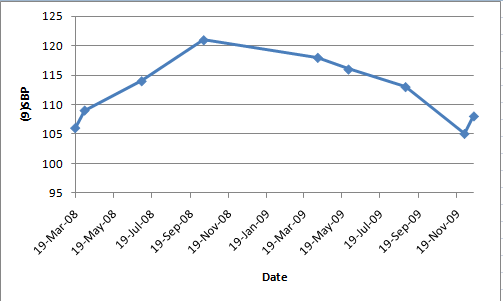
However, John’s blood pressure varied strangely during that time, as you can see on the chart below showing the variation of systolic blood pressure (SBP) against time. What could have been the reason for that? Salt intake is an unlikely culprit, as we’ve seen before.


As it turns out, John knew that heart rate could influence blood pressure somewhat, and he also knew that his doctor’s office measured his heart rate regularly. So he got the data from his doctor's office. When he entered heart rate as a column into HCE, the reason for his blood pressure swings became clear, as you can see on the figure below.


On the left part of the figure above are the correlations between SBP and each of the other health-related variables John measured, which HCE lists in order of strength. Heart rate shows up at the top, with a high 0.946 correlation with SBP. On the right part of the figure is the chart of SBP against heart rate.

As you can see, John's heart rate, measured at the doctor's office, varied from 61 to 90 bpm. Given that, John decided to measure his resting heart rate. John’s resting heart rate, measured after waking up using a simple wrist watch, was 61 bpm.

Mystery solved! John’s blood pressure fluctuations were benign, and caused by fluctuations in heart rate.

If John's SBP had been greater than 140, which did not happen, this could be seen as an unusual example of irregular white coat hypertension.

If you are interested, this YouTube video clip discusses in more detail the case above, from HCE’s use perspective. It shows how the heart rate column was added to the dataset in HCE, how the software generated correlations and graphs, and how they were interpreted.

Reference

Kock, N. (2010). HealthCorrelator for Excel 1.0 User Manual. Laredo, Texas: ScriptWarp Systems.